Part 1 – Exporting SAB data from HLA Fusion.
Step 1.1
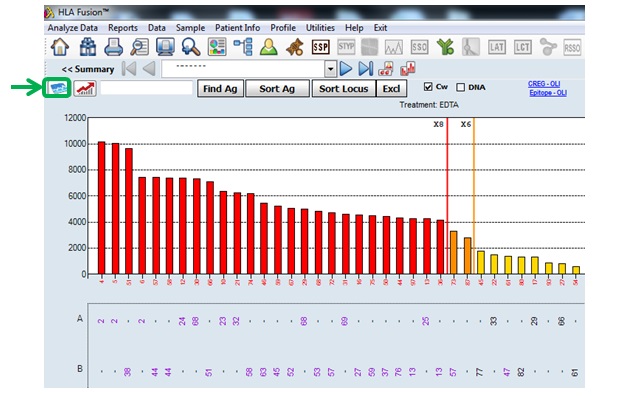
Navigate to any SAB result of your chosen patient and press the Patient Ab Tracking button (green box).
Step 1.2
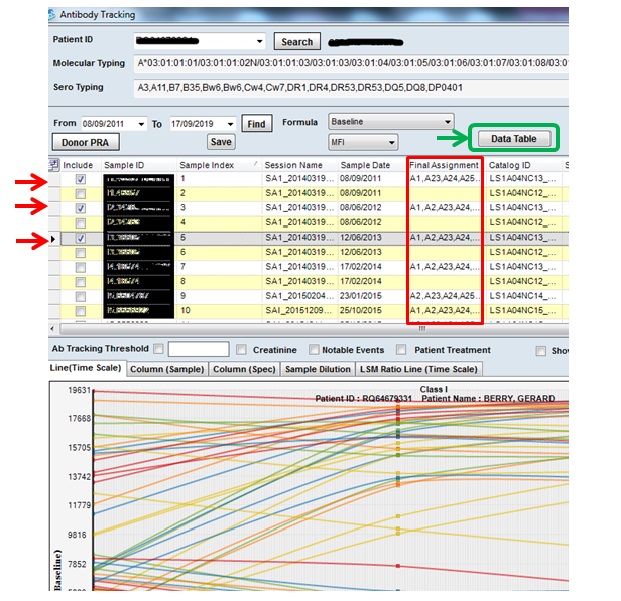
Choose class I and / or class II SAB results (indicated by red arrows) where Final Assignments have been made (shown in red box).
Once all selections are made press the Data Table button (green box).
Step 1.3
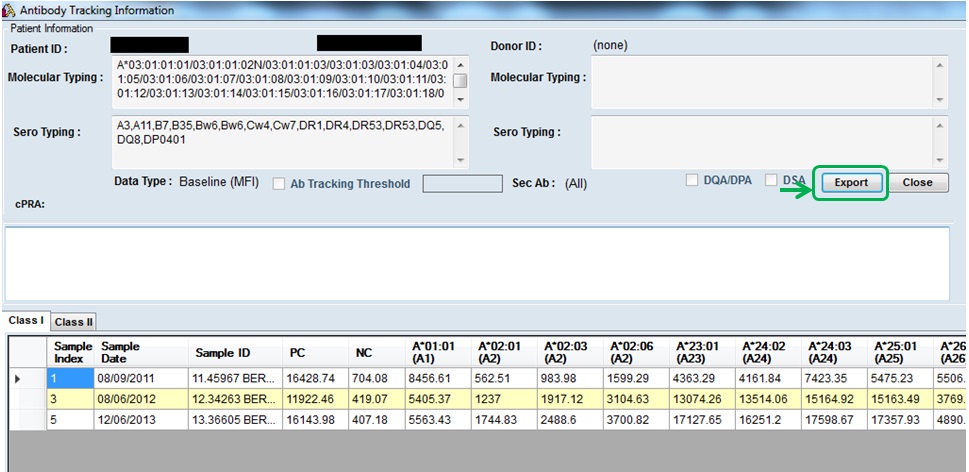
Press the export button (green box) and in the file save dialogue box, navigate to where you would like to save your results and press save.
Part 2 – Using Ab-delister
Step 2.1
Press the Choose file button, navigate to the SAB results csv file exported from HLA Fusion (step 1.3) and select it.
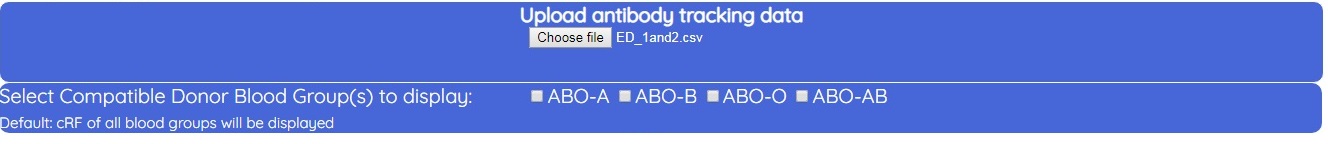
Responsive elements:
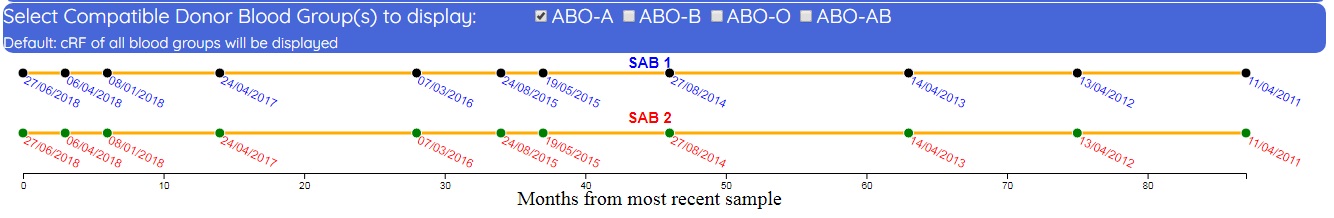
- After succesful upload a chart will appear showing the class I and / or class II sample dates that were exported.
Step 2.2 – optional
Select the ABO blood group of the patient (see image above). This is to display the appropriate cRF calculation on the results screen, however these can be toggled on /off at any time.
Step 2.3 – optional
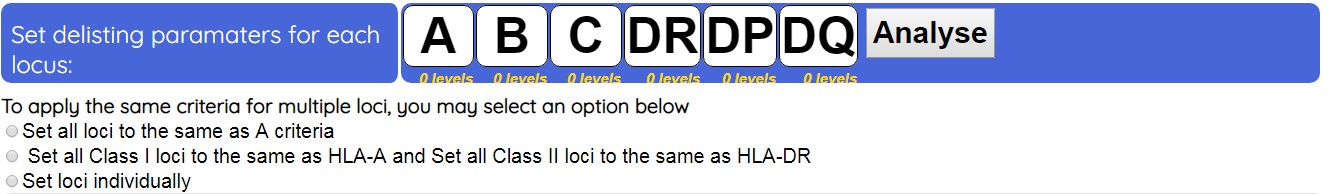
To apply the same parameter settings (MFI and time) to multiple loci, select an available option.
Responsive elements:- Locus delisting parameters will change to only show the HLA loci to which antibodies are detected.
Step 2.4
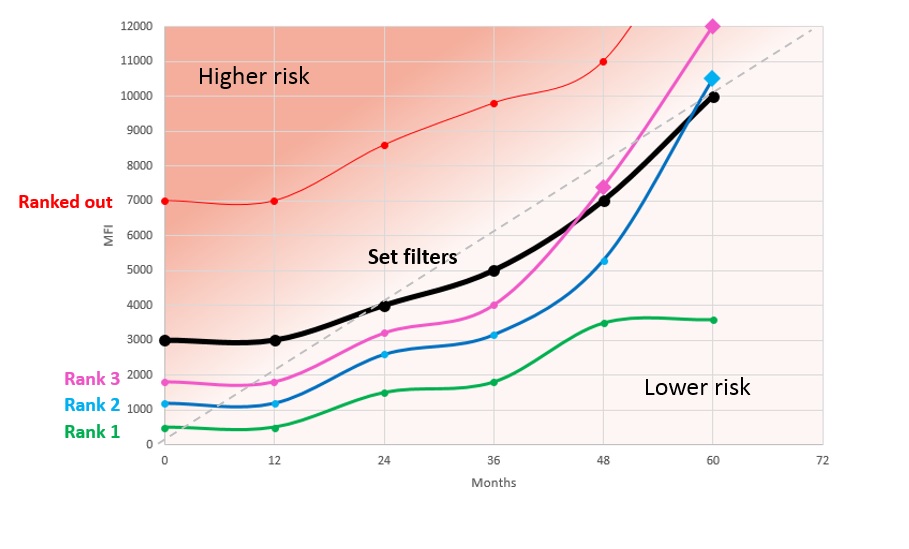
Set MFI and time parameters for all loci. For an individual locus, up to 5 incremental MFI settings (filters) can be applied as shown below
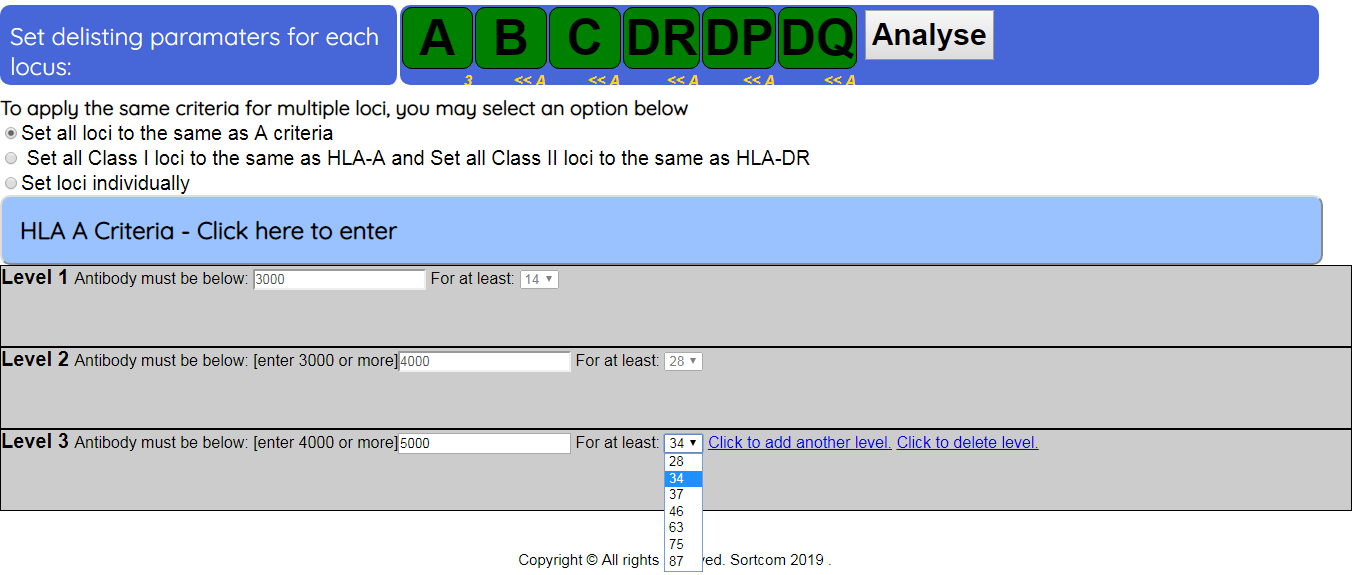
When choosing filter parameters a 'lower for longer' curve concept may be adopted, meaning
the filter parameters can represent a curve below which antibodies can be considered for de-listing.
Examples of differently ranked antibodies are shown as coloured curves in the graph below.
A Rank 1 antibody (green) obeys all the filter rules remaining under the parameter curve shown in black.
A Rank 2 antibody (blue) remains under the MFI parameter in all but the oldest sample as illustrated in the graph.
The table below shows the ranking rules.
Part 3 – Analysis Screen
Step 3.1
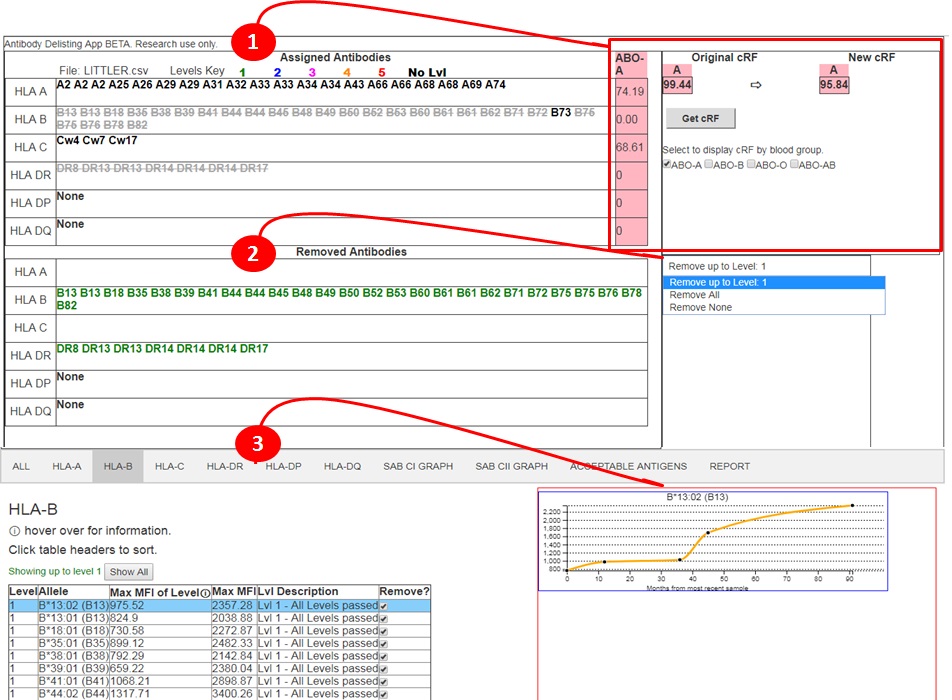
Annotation 1 - The top part of the analysis screen comprises the assigned antibodies section. Antibodies are colour-coded for each filter set according to the key given under the section title. This shows which antibodies are classed as being present (solid text, no strike through) for each loci and is used to calculate the cRF for each loci as well as the 'New' overall cRF. The Original cRF on the right hand side remains static and shows the cRF before any user-defined antibody removal. cRF is calculated for all ABO blood groups. ABO checkboxes allow users to show/hide cRF according to blood group.
Annotation 2 - The Removed Antibodies section shows which antibodies have been filtered out by rank according to the selection from the dropdown on the right hand side.
The first time the page loads, antibodies set to rank 1 are filtered from the 'Assigned antibodies' section into the 'Removed antibodies' section.
Antibodies within each filter are removed as a group.
Annotation 3 - Antibodies can added or removed individually by selecting the appropriate locus tab. Each tab shows a table of antibodies. Clicking on a row brings up a longitudinal graph of MFI for the antibody. Check or uncheck ‘Remove?’ to manually add or remove individual antibodies. The ‘Get cRF’ button in section 1 will change to red upon manual changes. Press this button to calculate the New cRF once all manual changes have been made.
Step 3.2
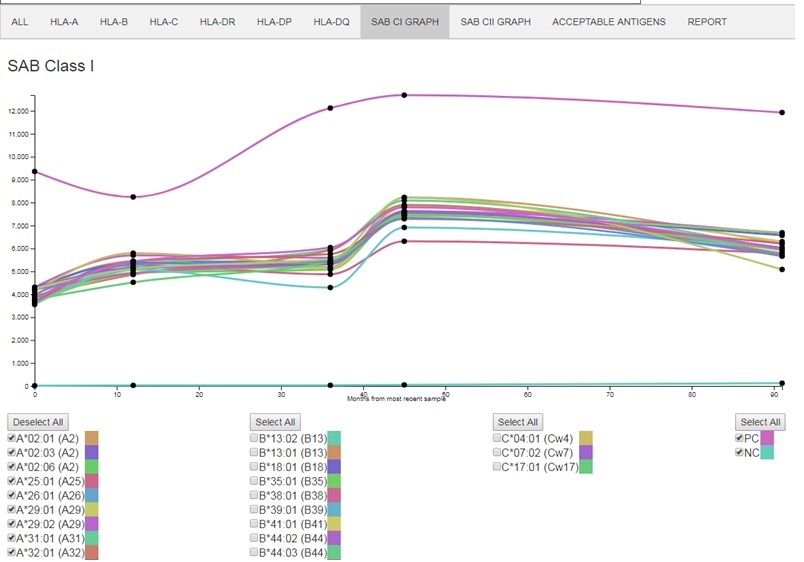
The SAB CI or SAB CII Graph tabs show longitudinal graphs for each antibody class collectively. Users can toggle on/off individual antibodies
Step 3.3
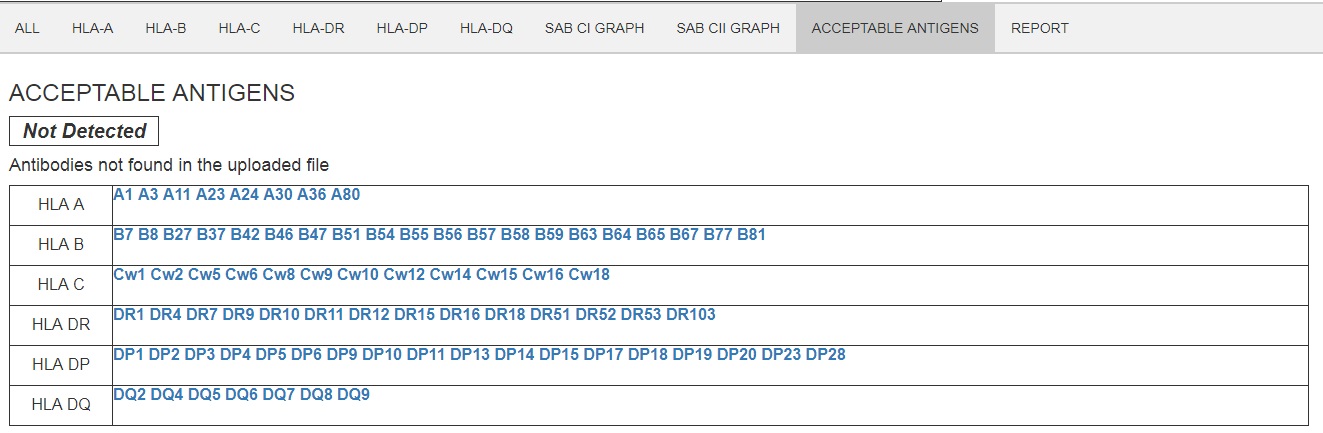
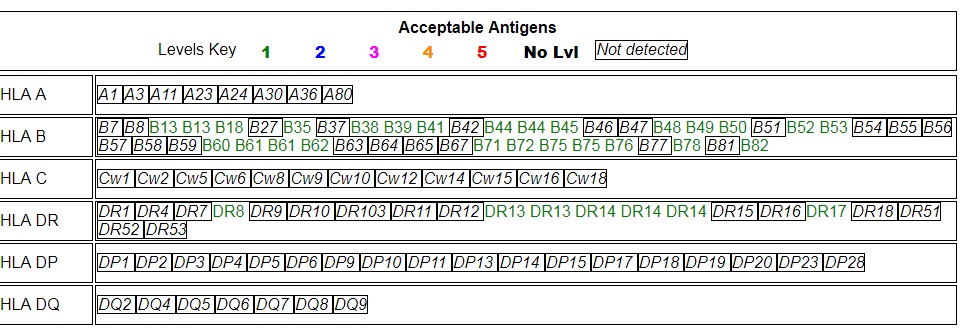
The Acceptable Antigens tab shows a table of antigens not detected in the imported SAB file. These will be included in the final report annotated by an outer box.
Step 3.4 - Report
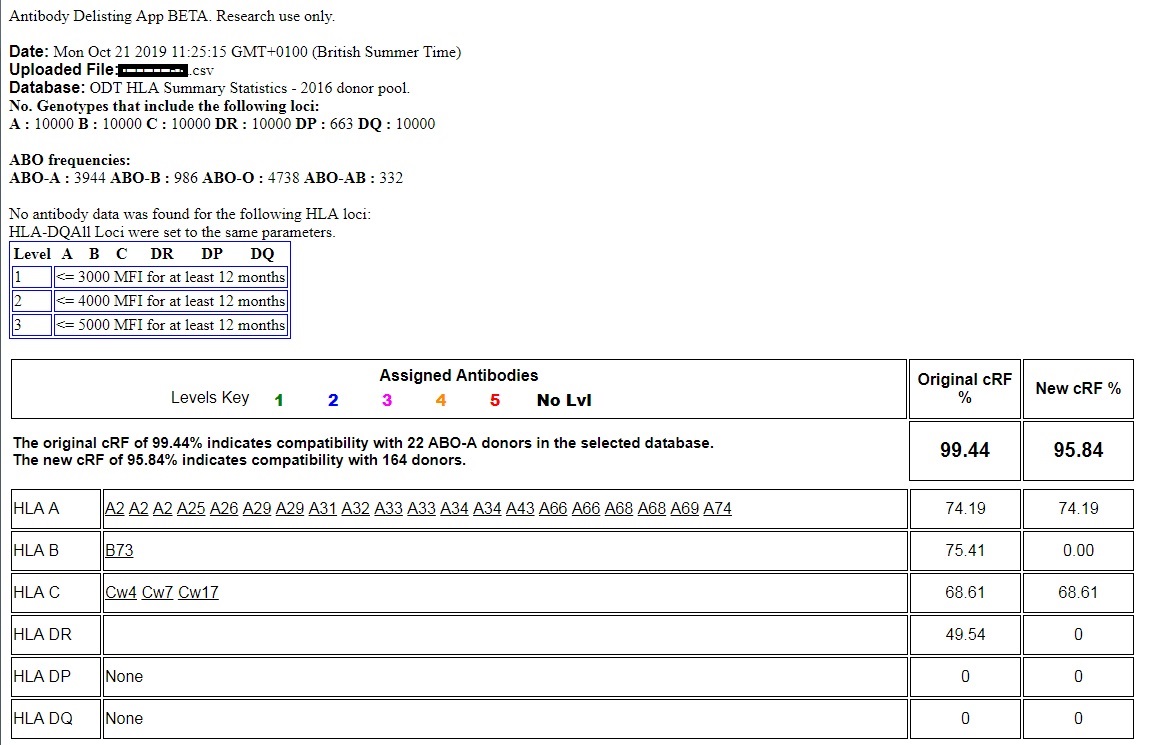
The Report Tab consists of 3 sections showing the final results.
Section 1 gives information about the database used to generate cRF%. It also lists the user-defined filters.
This section is where the Original and New cRF is displayed along with a table of antibodies used for the cRF calculation .
The table also calculates the number of actual donors for the original and new cRF% .
The Generate Report button allows all of the information on the report tab to be shown in a separate window that can be saved or printed. An ABO blood group must be chosen to display the correct cRF calculation.
Section 2 lists the acceptable antigens that consist of Removed antibodies and antigens to which antibodies were not detected in the SAB samples imported.
Removed antibodies are colour-coded to identify which filter they were removed by.
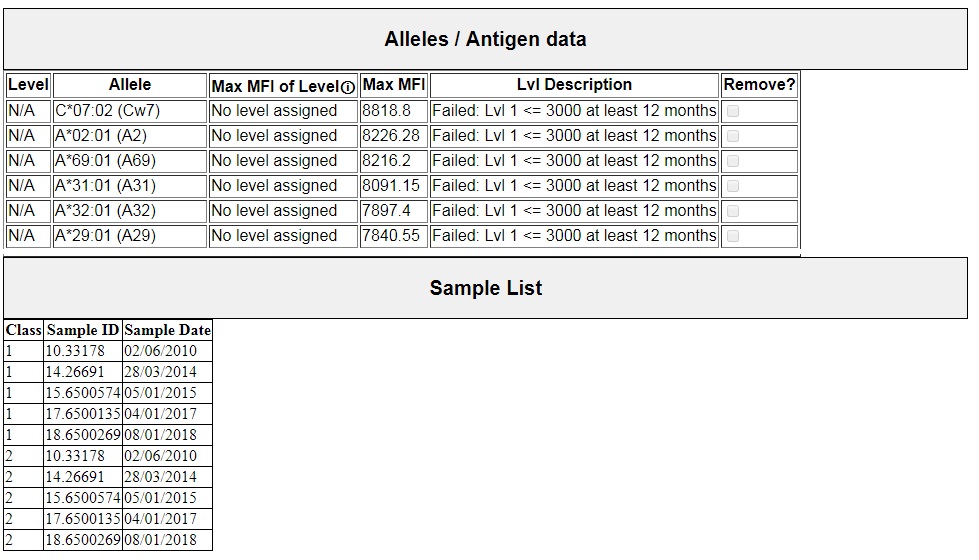
Section 3 shows a table (truncated in image below) of all SAB antibodies detected in the imported sample file, ordered by MFI (high to low) along with data such as status (Assigned / Removed), MFI and designated rank.
This section also lists information about the samples included in the analysis.